Why I Quit My 9-to-5 to Build Awatif
I quit my stable job to build Awatif. Working 9-to-5 felt like a prison, and I couldn't stand by while structural engineering remained inefficient.


I quit my stable job to build Awatif. Working 9-to-5 felt like a prison, and I couldn't stand by while structural engineering remained inefficient.

Discover how Awatif's three-level data structure—from parametric design through smooth geometry to discrete analysis—enables seamless collaboration.

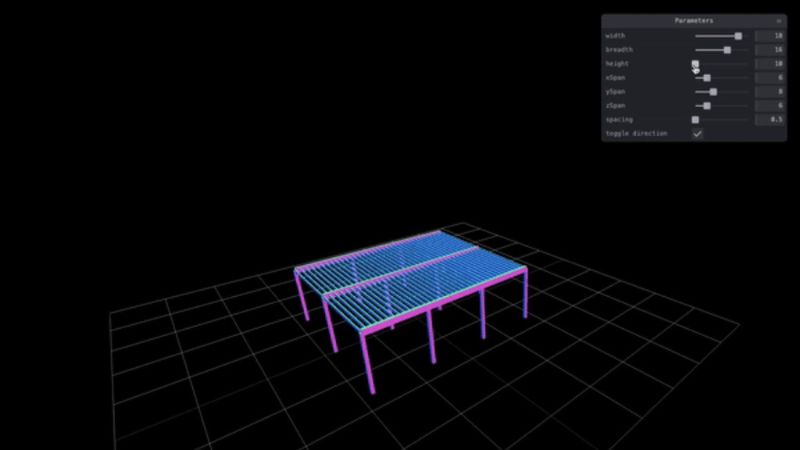
Learn how we built a hybrid 3D modeling tool combining manual flexibility with parametric efficiency.

Mohamed Adil joins Mayur Mistry's podcast to discuss his journey from structural engineering to software development and the story behind Awatif

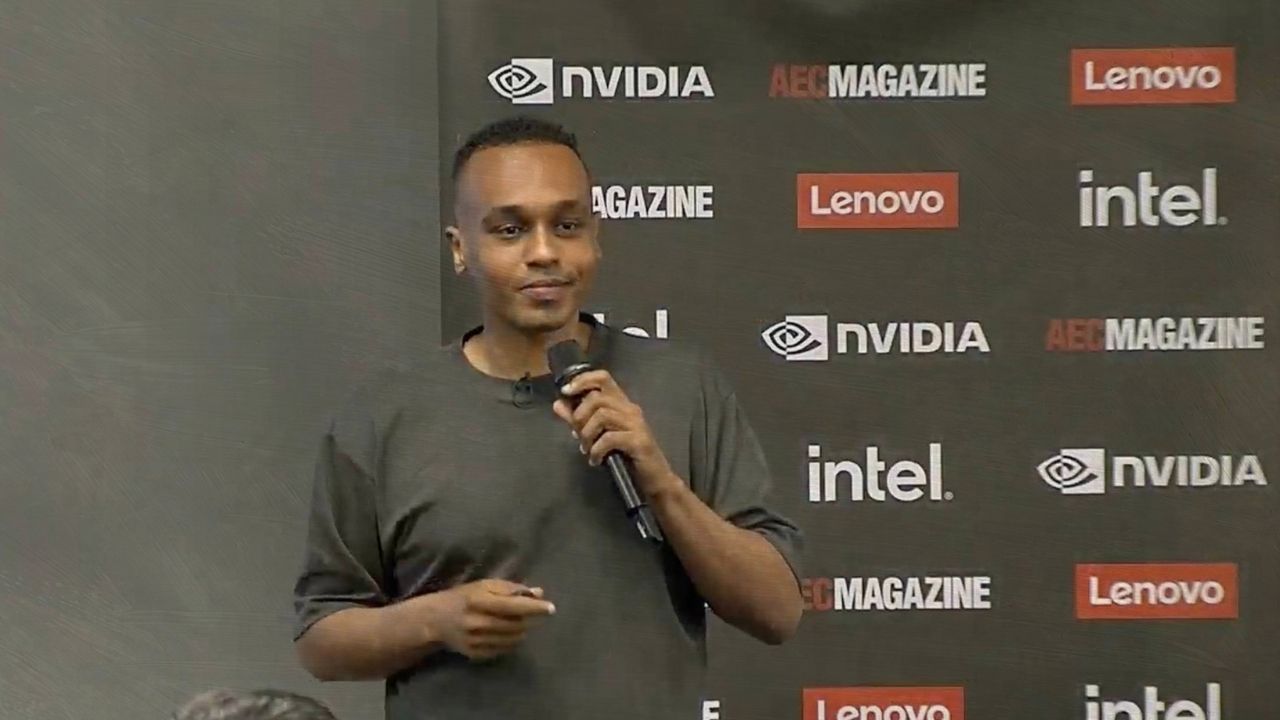
Highlights from Mohamed Adil's London conference talk on real-time physics, collaborative design, and the open-source roadmap behind Awatif.

A simple, energy-based intuition for FEM: strain, energy minimization, shape functions, and why discretizing complex structures works in practice.

How parametric modeling empowers automation, exploration, optimization, complex geometry, and sensitivity analysis in structural engineering.